Building a streaming pipeline using SQL with Google Dataflow
in Blog

What is real-time data
Real-time data is data that is delivered the moment it is collected. This enables you to process and query those data to inform decisions or fuel data applications. There are some terminologies out there, such as real-time, near real-time, and batch. The difference between these three is not clearly defined, but you can roughly use the following guideline (IMHO).
Real-time: sub-second/minute latency, worst accuracy.
Near real-time: 1–5 minutes latency, better accuracy.
Batch: anywhere above 5 minutes latency from 1 hour, 1 day to 1 week, best accuracy.
Unless you need to process financial transactions, most streaming analytics use cases will fall under the near real-time category. For example, if you run a promotional campaign, you will need to send a message to a customer if their purchase meets certain standards. In this case, you can get away with doing so a couple of minutes after the purchase happen.
The value of real-time data
Having real-time access to data is beneficial to many businesses as data is the lifeblood of many nowadays. Instead of relying on outdated, slow-to-update information, you can access up-to-date information for better decision-making. Most modern data warehouses and BI tools support streaming insert and query, so your company can access real-time metrics.
Better yet, many of the decisions can be made autonomously using a streaming pipeline and some business logic. For example, you can notify customers after adding a product to carts but not checked out in the last 30 minutes.
Building streaming pipeline with SQL
Real-time data used to be accessible to well-funded tech startups or corporate with million of dollars budgets. You would typically need a team of data engineers to build and maintain streaming pipelines too. However, with the advancement of cloud computing and the open-source data community, many of these capabilities are opening up for us all.
The business case
Say you are an e-commerce company, and there is a marketing campaign to reward any customers who spent more than $5,000 and make a new purchase. You want to send an app push to congratulate these customers when they make a new purchase. You also need a real-time dashboard to keep track of how the campaign is going. The development team said they are at capacity and won’t help you with this campaign, so you are on your own.
A task like this would typically take two sources of data and combine them. You would need to query your data warehouse to get all customers who spent more than $5,000. You would also need real-time data to capture new transactions within today. This is also known as the lambda architecture, where you have a batch layer that runs at least once a day and a speed layer streaming data in real-time.
](https://cdn-images-1.medium.com/max/2000/0*IYM_0z4nuH4keSQZ.png)
Lambda architecture — Image source: Wikipedia
The architecture
Assuming that your development team is nice enough to build a streaming source of your order and customer data (this is actually a prerequisite), our architecture would look as follow.
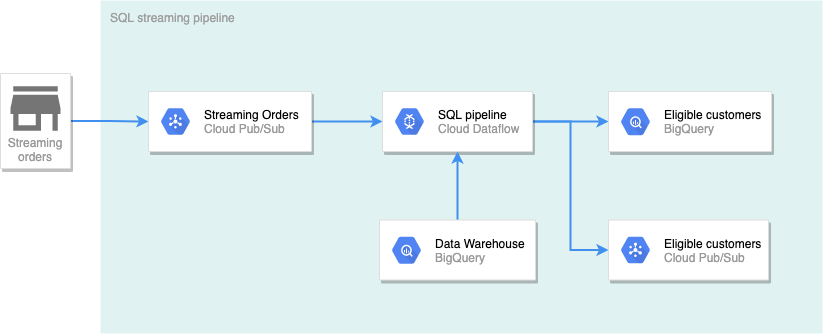
Diagram by author
In this architecture, new orders (within the day) are streamed to Pub/Sub. The pipeline created by Dataflow will check every new purchase to see if the customer is within the list of customers who spent more than $5,000. The results will be written into two destinations. Results to BigQuery will be used for real-time dashboard with a visualization tool. Results written to Pub/Sub will be used to send push notifications to the winning customer.
Getting started
Here are some prerequisites to getting started:
A Google Cloud account
An active billing account (you can sign up for the $300 free trial)
A Google Cloud project
Activate Cloud Shell — GIF by the author
Clone this repo to the Cloudshell by running:
# Clone the repo locally
git clone [https://github.com/tuanchris/dataflow-sql](https://github.com/tuanchris/dataflow-sql)
cd dataflow-sql

# Install requirements
pip3 install -r requirements.txt
Create Data Sources
We need two data sources for our streaming pipelines as follow:
1. A BigQuery Batch source — all orders and customers information and is updated daily
# This script will create 100 customers with 1000 orders
python3 generate_data.py batch \
  --customer_count=100 \
  --order_count=1000 \
  --project_id=$DEVSHELL_PROJECT_ID
# Replace the project_id varaible if you are running locally
Select “Authorize” when Cloud shell asks to authenticate your requests.
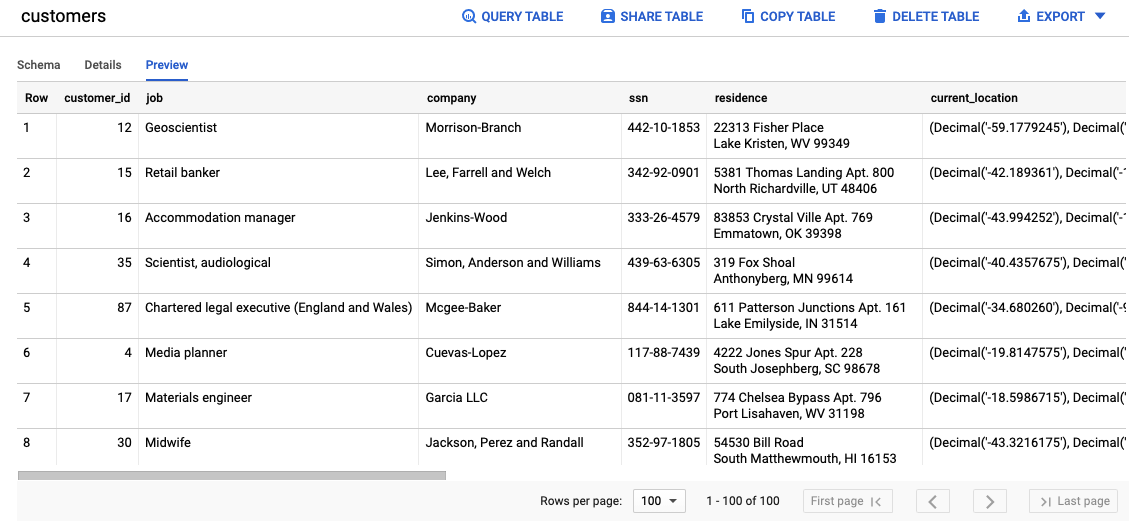
Generated customers table — Image by author
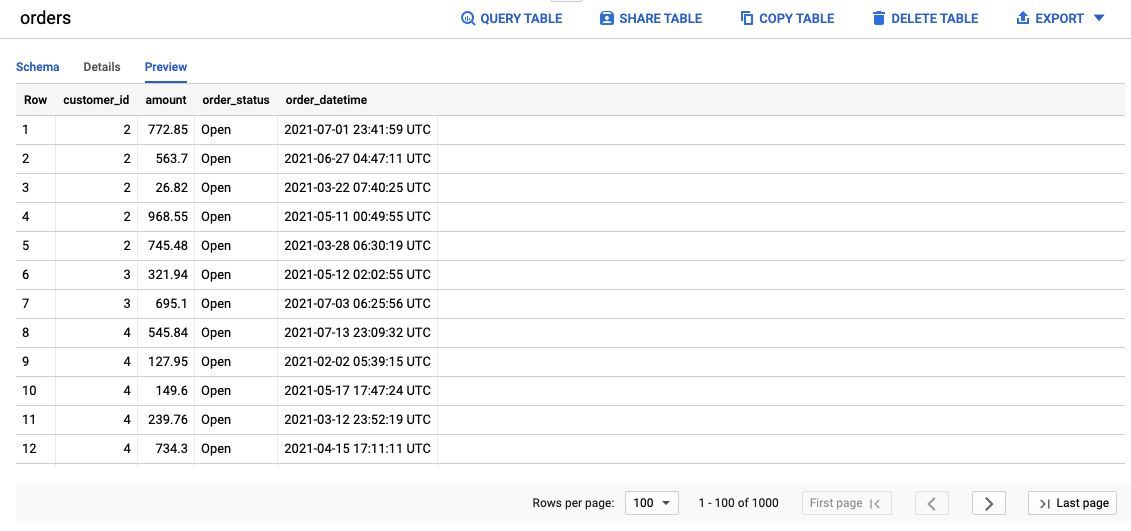
Generated orders table — Image by author
2. A Pub/Sub topic called orders — a stream of order data that arrives via a subscription to the Pub/Sub topic
# Create a Pub/Sub topic
gcloud pubsub topics create orders

# Generate a stream of order data to Pub/Sub
python3 generate_data.py stream \
  --customer_range 100 \
  --project_id $DEVSHELL_PROJECT_ID
Simulated orders streaming to Pub/Sub in real-time — Image by author
Add Pub/Sub source to BigQuery
To add the Pub/Sub source to BigQuery, follow the following steps:
- Change the query engine in BigQuery to Cloud Dataflow Engine
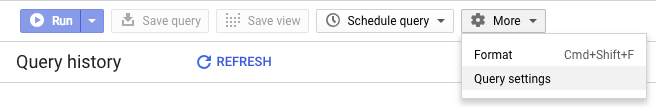
Change query settings — Image by author
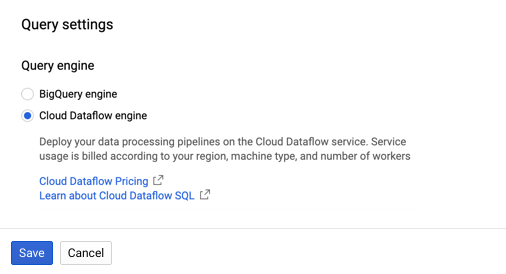
Change query engine to Cloud Dataflow — Image by author
2. From the BigQuery UI, select Add Data and choose Cloud Dataflow sources
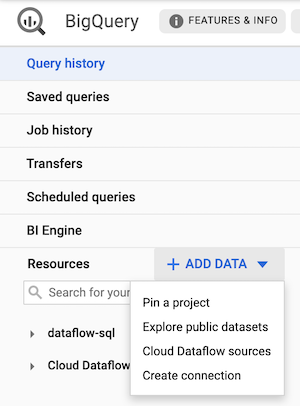
Add a Cloud Dataflow source — Image by author
3. Add the Pub/Sub topic source
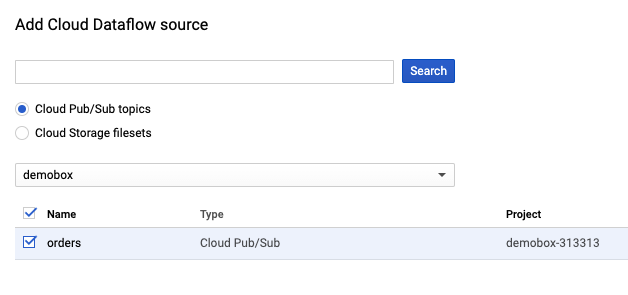
Choose the project and the Pub/Sub topic — Image by author
4. Add a schema for the orders topic
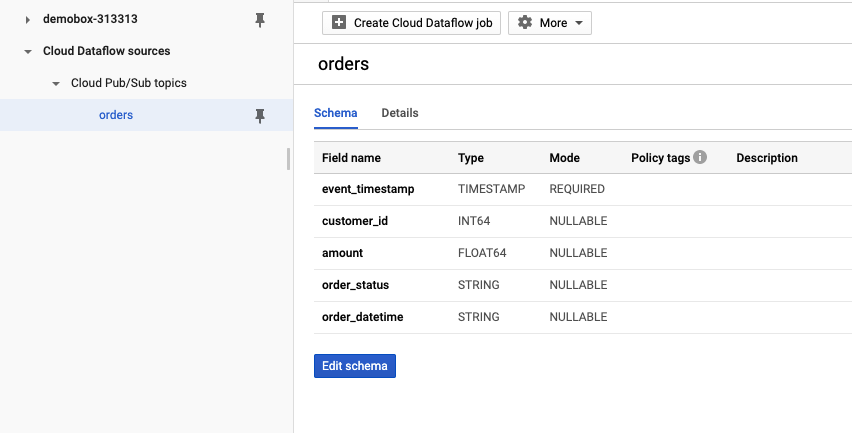
Select the added orders topic and click on Edit schema — Image by author
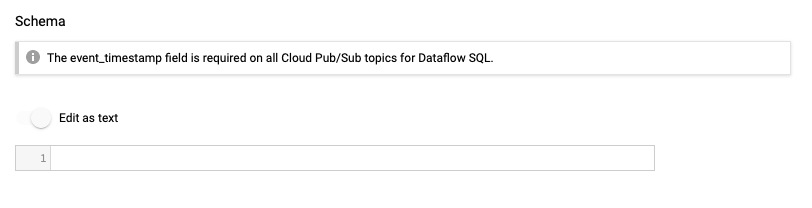
Toggle Edit as text and paste in the following values — Image by author
[
    {
        "name": "event_timestamp",
        "description": "",
        "mode": "REQUIRED",
        "type": "TIMESTAMP"
    },
    {
        "name": "customer_id",
        "description": "",
        "mode": "NULLABLE",
        "type": "INT64"
    },
    {
        "name": "amount",
        "description": "",
        "mode": "NULLABLE",
        "type": "FLOAT64"
    },
    {
        "name": "order_status",
        "description": "",
        "mode": "NULLABLE",
        "type": "STRING"
    },
    {
        "name": "order_datetime",
        "description": "",
        "mode": "NULLABLE",
        "type": "STRING"
    }
]
Write a SQL query
Here is a simple SQL query that will answer our business question.
WITH
  eligible_customers AS (
  SELECT
    o.customer_id,
    SUM(o.amount) AS total_spent
  FROM
    bigquery.table.`demobox-313313`.ecommerce.orders o
  WHERE
    o.order_status = 'Closed'
  GROUP BY
    1
  HAVING
    total_spent >= 5000)
SELECT
  o.*,
  ec.total_spent
FROM
  pubsub.topic.`demobox-313313`.orders o
INNER JOIN
  eligible_customers ec
USING
  (customer_id)
WHERE
  o.order_status != 'Cancelled'
We first select the data from the orders table, filter out only “Closed” orders, then group by the customer, calculate total spending, and filter out customers who purchased $5,000 or more. We then inner join the list of eligible customers to any new transactions, filtering out transactions with Cancelled status.
You can see that it is easy writing SQL like above, and any Analyst can do it. Be sure to substitute your project_id when trying this out.
Create a Dataflow job
With the query ready and validate, you can select Create Dataflow job from the BigQuery UI. Configure two destinations as per the image below. You can keep other values to the default one.
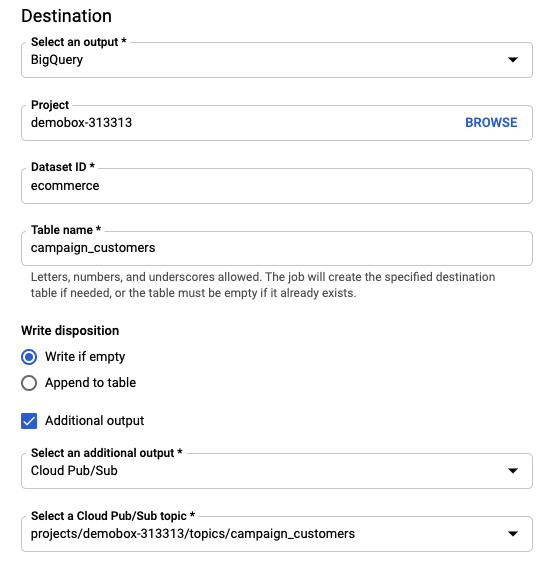
Configure a BigQuery destination and a Pub/Sub destination — Image by author
After creating the Dataflow job, you can see the result below. Follow the link in Job ID to view your Dataflow job and its status.
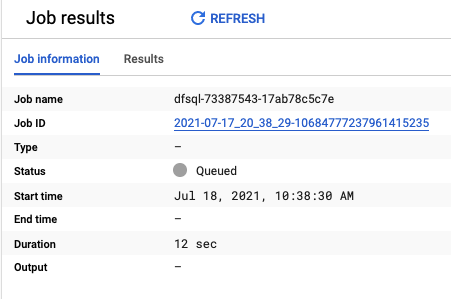
Dataflow creation result — Image by author
It can take 3–5 minutes for the Dataflow job to startup. After that, you should be able to the pipeline as follow.
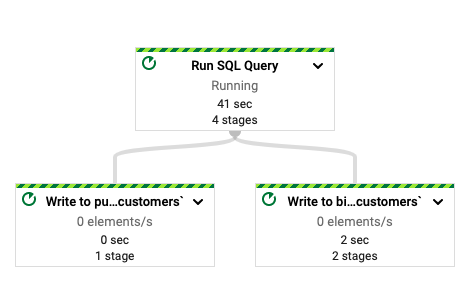
Dataflow SQL pipeline — Image by author
Verifying the results
After the Dataflow job is successfully startup and running, you can go to BigQuery and Pub/Sub to verify that our pipeline is working as intended.
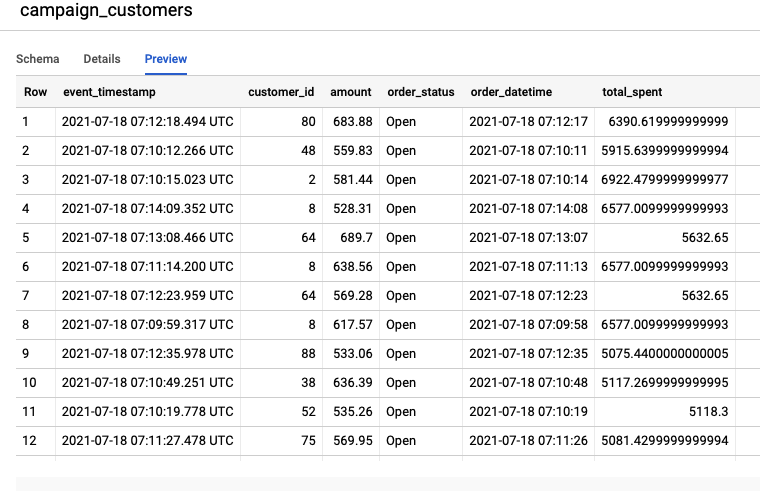
List of customers who purchased more than $5,000 with new transactions — Image by author
With the running Dataflow job, we can see all sorts of job metrics about our pipeline. For example, it takes 11 seconds for the data to be processed by Dataflow, not bad!
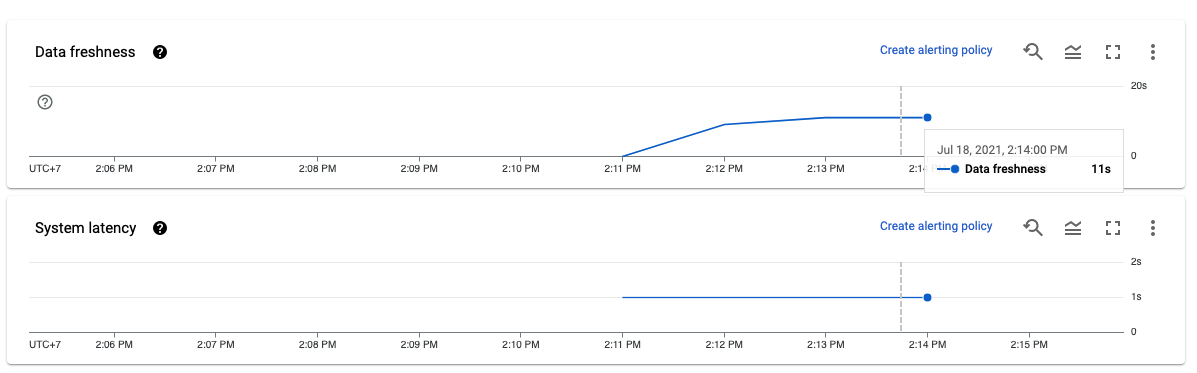
Data freshness report — Image by author
Clean up
Be sure to cancel the Dataflow pipeline, delete the Pub/Sub topic, and delete the BigQuery dataset to avoid incurring costs.
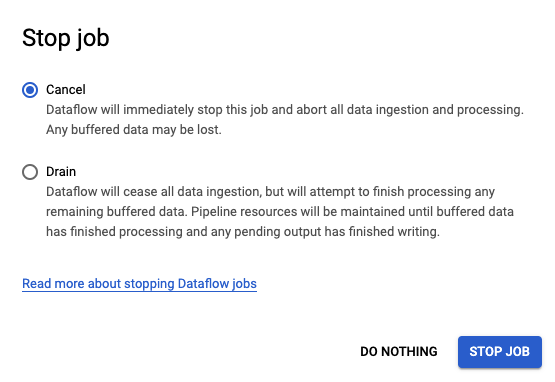
Cancel Dataflow job — Image by author
Conclusion
Real-time data used to be expensive and reserved only for the most skilled Data Engineers. It is still expensive and requires a fair amount of technical knowledge to do. However, with managed tools like SQL Dataflow or open-source alternatives like KSQL for Kafka and Spark SQL, streaming analytics is hopefully democratized and more accessible.
Happy learning!